


Show Your Stripes: The Climate Graphic That Says It All
🌍
Climate Change Made Visible: What the “Show Your Stripes” Graphic Teaches Us About Energy, Heat & Hope
What if climate change could be understood at a glance?
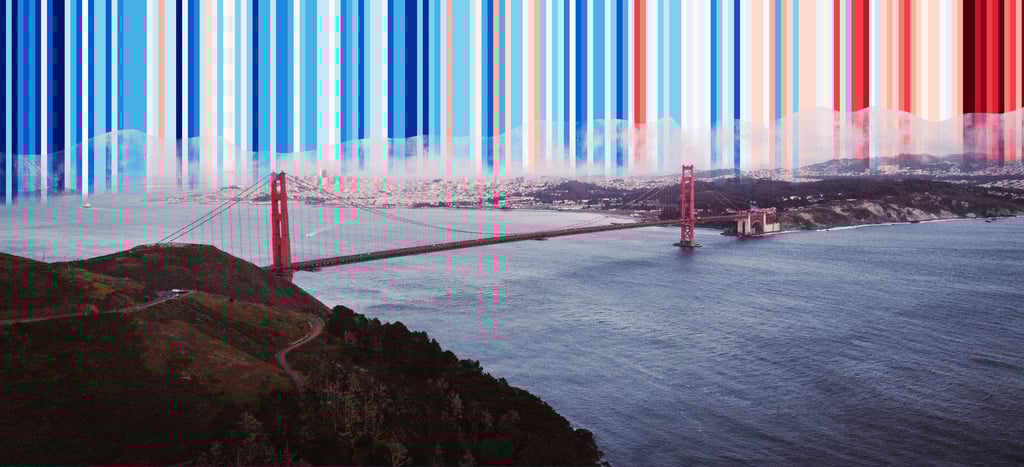
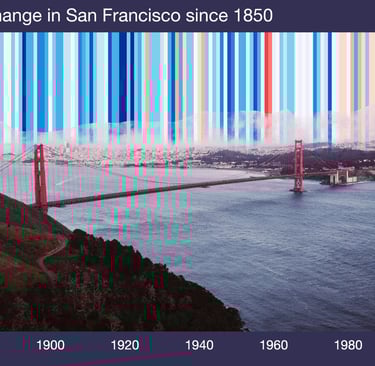
That’s exactly what the Show Your Stripes graphic does. Created by climate scientist Ed Hawkins, this now-iconic image uses a series of colored stripes — blue for cooler years, red for hotter ones — to visualize more than a century of global temperature data. No numbers. No jargon. Just a clear, undeniable shift from cool to hot, from balance to crisis.
This is data visualization for impact — and it has become a symbol for climate awareness across the globe. You’ll find it on T-shirts, murals, and even national weather services. Why? Because it speaks truth, simply and powerfully.
But the big question remains:
Can we still do something about it?
Yes. And here’s where design, energy, and action come together.
Energy Matters: Why Shifting to Renewables Makes a Difference
One of the core drivers behind these changing colors? Fossil fuels. Burning coal, oil, and gas releases greenhouse gases that trap heat in the atmosphere. But we already have the solutions at hand. Clean energy alternatives like solar, wind, geothermal, and hydro are not science fiction — they’re growing realities.
Designers, entrepreneurs, and everyday citizens can push for this shift by supporting energy-conscious businesses, investing in greener infrastructure, or simply demanding cleaner options. Every solar panel, every wind turbine, every design decision rooted in sustainability counts.
Design is not just how things look — it’s how they work. And when systems are built with regeneration in mind, we reduce heat, emissions, and ecological pressure.
Lifestyle Choices: Yes, Your Plate and Commute Matter
Another often-overlooked piece of the climate puzzle is how we live — what we eat, how we move, and how we build our cities.
Transportation and diet have major climate footprints. That means less meat, more plants. Less traffic, more bikes. These aren’t just sacrifices — they’re pathways to better health, better cities, and a cooler planet.
If you’re a creative, a researcher, or an ecopreneur trying to align your lifestyle with your values, this is the place to start. Use your voice, your visuals, and your platform to show what’s possible. You don’t have to be perfect — just aware and intentional.
Heat Is Not Just Environmental — It’s Social
As temperatures rise, so do inequalities. Extreme heat affects vulnerable communities first and worst. Public health systems are strained. Marginalized groups face greater risk. Climate justice is no longer a fringe concept — it’s central to how we design the future.
If you’re telling a climate story, don’t forget the human side. Behind every data point, there are lives, decisions, and untapped opportunities for change.
So, What Can You Do?
📊 Use visuals that speak: The Show Your Stripes image is free to use and available in multiple formats. Use it in your presentations, decks, or social media to spark real conversations.
⚡ Talk about energy: The conversation isn’t just about guilt — it’s about growth. Let’s redesign our systems to be more efficient, beautiful, and fair.
🌱 Live the message: Whether you’re a scientist, designer, artist, or ecopreneur, your daily choices shape the story we tell about climate. Choose wisely, and tell others how you got there.
Let’s Make Climate Visible
At Gogoa Studio, we believe in making science and sustainability visible through high-impact design and storytelling. If you’re working on climate communication, energy innovation, or environmental education — let’s talk.
Because the planet is warming. But so is our collective creativity.
📩 Reach out. Let’s design change, together.

Conecta
Ideas@gogoa.com.co
© 2025. All rights reserved.
Ig : Gogoa Studio